Growth")
In business, numbers are everything but raw numbers don’t always tell the whole story. Revenue might be up this month, but is it better than this time last year? Are you growing, or just reacting to seasonal swings?
That’s where Year over Year (YOY) growth comes in. It’s more of a perspective instead of a metric.
Year over Year growth helps you compare apples to apples, stripping away noise and giving you a cleaner view of how your business is performing over time. This kind of analysis is critical for making strategic decisions, securing funding, setting benchmarks, and identifying patterns in your growth.
Table of Contents
The Basics: What Is YOY Growth?
Year over Year growth is the percentage change in a given metric—usually revenue or profit—from one year to the next, during the same period. It tells you whether you’re making real, sustained progress.
For example:
If your company made $200,000 in Q2 of 2024 and $160,000 in Q2 of 2023, your YOY revenue growth for that quarter is:
YOY Growth = [(200,000 – 160,000) / 160,000] × 100 = 25%
That’s a 25% improvement in revenue compared to the same quarter last year.
It’s simple, yet incredibly insightful.
Are you currently managing your bookkeeping in-house?
How To Calculate Year Over Year Growth? (Step-by-Step)
Understanding the year over year growth formula is just step one. Here’s how to apply it properly across different business metrics.
The year over year growth formula:
YOY Growth (%) = [(Current Year Value – Previous Year Value) / Previous Year Value] × 100
Example 1: Revenue Growth
- 2023 Revenue (Q1): $150,000
- 2024 Revenue (Q1): $180,000
- YOY Growth = [(180,000 – 150,000) / 150,000] × 100 = 20%
Example 2: Website Visitors
- 2023 March Visitors: 10,000
- 2024 March Visitors: 13,000
- YOY Growth = [(13,000 – 10,000) / 10,000] × 100 = 30%
Tip for You: Always ensure the timeframes match. Compare March to March, Q2 to Q2—not Q1 to Q4. Seasonality can drastically affect results.
What Metrics Can YOY Growth Be Applied To?
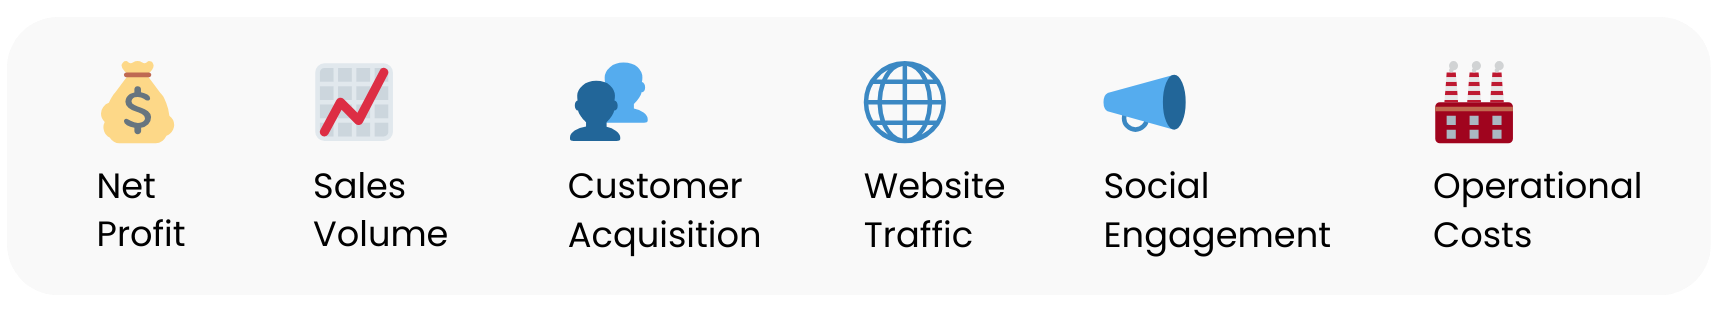
While revenue is the most common use case, the beauty of YOY growth is its flexibility. You can apply it to nearly any performance metric, such as:
- Net profit – Is your business becoming more profitable year over year?
- Customer acquisition – Are you attracting more new clients this year?
- Operational costs – Are expenses increasing faster than revenue?
- Social engagement – Is your brand growing its presence online?
- Sales volume – Are units sold trending upward?
The Real-World Value of Tracking YOY Growth
Understanding how to calculate YOY growth is just the beginning. The real power comes from using it to:
-
Spot Trends
If your business is growing 10% YOY for three years straight, that’s a healthy upward trend. But if growth dips or goes negative, you’ll catch it early—and act accordingly.
-
Support Investor Conversations
Investors want to know if your growth is sustainable. YOY growth figures help you tell that story clearly and credibly.
-
Benchmark Performance
Are your competitors growing faster? Are you outperforming the market? YOY growth allows direct comparisons.
-
Improve Forecasting
YOY trends help inform next year’s budget, hiring plans, marketing spend, and product development strategy.
Tip for You: Track YOY growth monthly, quarterly, and annually. It helps catch short-term problems while keeping an eye on the long game.
What’s a “Good” YOY Growth Rate?
This is one of the most searched questions—and like many things in business, the answer depends on context.
Here’s a general guide:
- 5–10% YOY: Solid for mature companies
- 10–20% YOY: Strong and sustainable for most small businesses
- 20–50% YOY: Great for high-growth startups
- 50%+ YOY: Possible in early hyper-growth phases, but rarely sustainable long term
Of course, not all growth is good. If you’re scaling fast but burning cash, or growing revenue while profits shrink, that’s a red flag.
YOY Growth vs. Other Metrics: Know the Difference
| Metric | Best Use Case | Watch Out For |
| YOY Growth | Long-term performance tracking | Doesn’t reflect short-term dips |
| MOM Growth | Monthly trend detection | Highly volatile |
| QOQ Growth | Seasonal business comparisons | Shorter insight window |
| CAGR | Multi-year average growth analysis | Doesn’t show fluctuations |
Each metric serves a purpose. But year over year growth remains a gold standard for performance tracking over time.
Explore Our Tools: Tax Deductions Calculator
Common Mistakes to Avoid with YOY Analysis
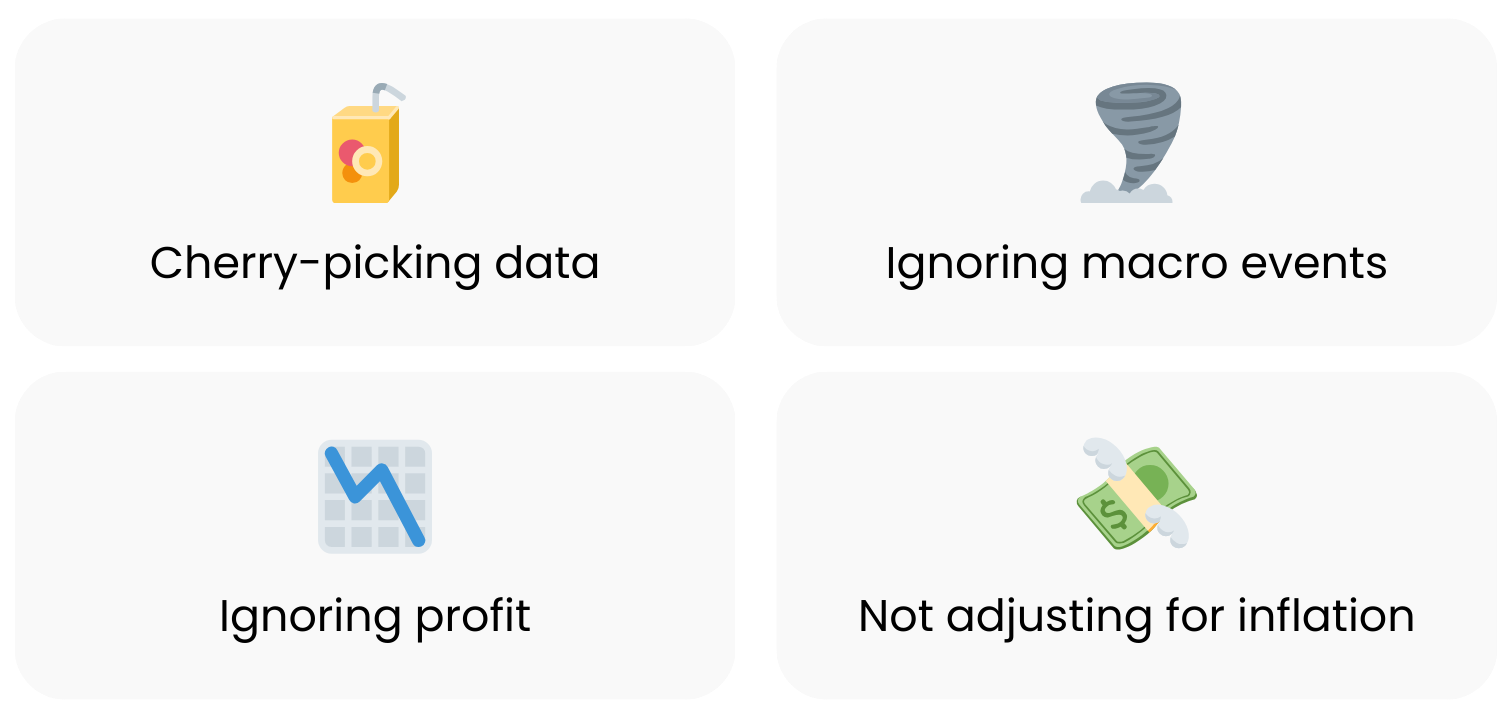
Even though the math is simple, the interpretation can get tricky. Here are a few pitfalls to watch out for:
- Cherry-Picking Time Periods
Only comparing your best months or quarters doesn’t give an honest picture. - Ignoring External Factors
Things like supply chain disruptions, economic downturns, or major market shifts can skew results. - Overlooking Net Profit
Growing revenue means little if your margins are shrinking. Always compare YOY profit, not just sales. - Failing to Adjust for Inflation
In periods of high inflation, make sure you’re calculating real growth, not just inflated numbers.
Conclusion – Let Orbit Accountants Help You Turn Growth into Strategy
Orbit Accountants don’t just look at numbers, we look at what they’re trying to tell you. Whether it’s year-over-year growth or deeper performance trends, we help you make sense of the data and turn it into a confident strategy. If you’re planning to scale or just make smarter financial decisions, we’re here to guide you.
Let’s talk about real growth—the kind that’s steady, strategic, and built to last. Reach out to Orbit Accountants today.
Frequently Asked Questions:
How do I calculate and use YOY growth?
Use the standard formula. Then apply your insights to planning, budgeting, and measuring performance against goals.
How do you calculate revenue growth from year to year?
Subtract last year’s revenue from this year’s, divide the difference by last year’s, and multiply by 100 to get a percentage.
What is a good YOY growth rate for a business?
Anywhere between 10%–20% is considered strong and sustainable for most businesses. Startups may aim higher depending on funding and market conditions.
What is considered strong YOY revenue growth?
It depends on your size and industry. In fast-moving sectors like tech, anything over 30% is often impressive. For established companies, even 5% consistent YOY growth is excellent.